Latest ‘State of Buzzards Bay’ score reflects encouraging pause in decline of local waters
Harmful nitrogen pollution in Buzzards Bay did not get worse in 2015 for the first time in over a decade, reflecting an encouraging pause in the decline of the health of local harbors, coves, and tidal rivers, according to the Coalition’s latest State of Buzzards Bay report.

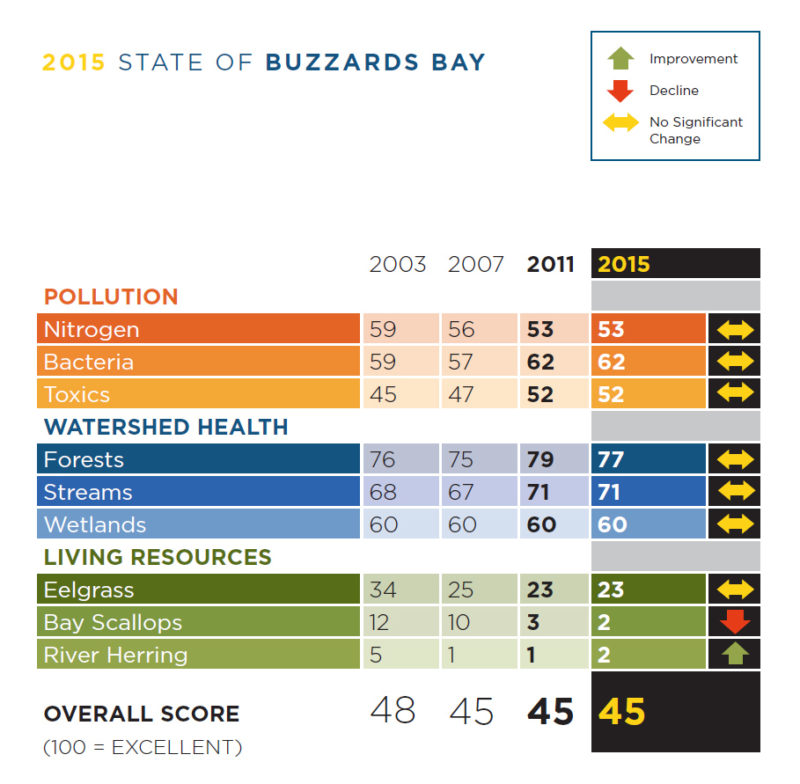
Overall, Buzzards Bay received a score of 45 out of 100 in the 2015 State of Buzzards Bay report. (View full report)
After falling at a dramatic rate of three points every four years since 2003 – when the Coalition released its first State of Buzzards Bay report – the nitrogen pollution score levelled off in 2015.
“Since 2003, we have documented troubling trends in the health of Buzzards Bay. No factor has continued to suppress Bay health and restoration efforts more than nitrogen pollution,” said Coalition President Mark Rasmussen. “But local efforts to clean up nitrogen pollution from septic systems and sewer plants, as well as to prevent new sources of pollution, may be beginning to stop these declines.”
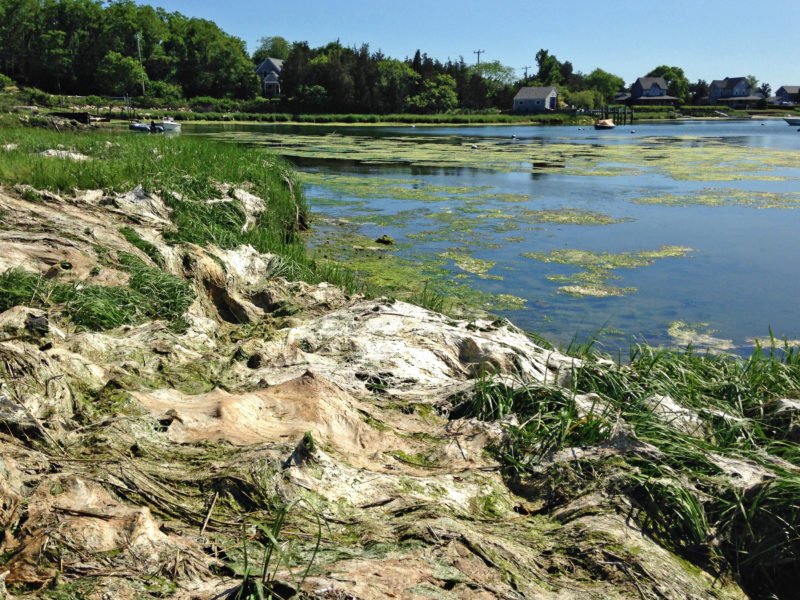
Nitrogen pollution is the biggest threat facing the health of Buzzards Bay. Data collected through the Coalition’s Baywatchers monitoring program show that more than half of the Bay’s harbors, coves, and tidal rivers suffer from nitrogen pollution – from West Falmouth Harbor all the way to the Westport Rivers. When water is polluted with nitrogen, it becomes cloudy and murky with algae, and fish, shellfish, and eelgrass begin to disappear.
“While we celebrate the pause in Bay decline documented in this report, more work lies ahead to reclaim the Buzzards Bay of our parents’ childhoods – a Bay of sparkling, clear water and abundant fish and shellfish,” said Rasmussen. “The formula for pulling the Bay out of the hole we created is clear: continued vigilance to protect our most critical forests, wetlands, and stream buffers, and bold action to clean up nitrogen pollution from septic systems.”
The State of Buzzards Bay uses nine different indicators to track the health of Buzzards Bay. These indicators are grouped into three categories: Pollution, Watershed Health, and Living Resources. Overall, Buzzards Bay received a score of 45 out of 100.
Pollution

When water is polluted with nitrogen, it becomes cloudy and murky with algae, and fish, shellfish, and eelgrass begin to disappear.
Nitrogen
The 2015 nitrogen score of 53 is the same as it was in 2011 – the first time since 2003 that the score has not declined. Towns across the Bay are taking steps to reduce nitrogen pollution, and those actions are working to stop the Bay’s decline.
Bacteria
The 2015 bacteria score of 62 did not change from 2011. Since that year, only 12 acres of Buzzards Bay’s shellfish beds have reopened to harvest. Once a near-steady source of improvement, the trend of reopened shellfish beds has leveled off over the past eight years.
Toxics
The 2015 toxics score of 52 did not change from 2011. Thanks to stricter laws and better enforcement, toxic pollution in Buzzards Bay has decreased dramatically. But in certain places around the Bay, toxic contamination still presents a problem for both people and marine life.
Watershed Health

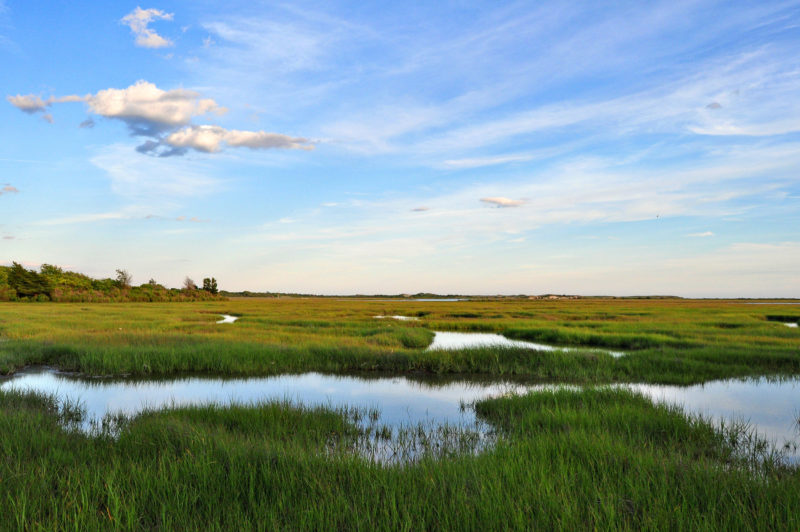
Despite layers of laws designed to protect wetlands, Buzzards Bay lost 265 acres of salt marshes, wooded swamps, and freshwater wetlands to development over the past 15 years spanning 1997-2012.
Wetlands
Despite layers of laws designed to protect wetlands, Buzzards Bay lost 265 acres of salt marshes, wooded swamps, and freshwater wetlands to development over the past 15 years spanning 1997-2012. Eleven percent of that destruction occurred since our last State of Buzzards Bay report in 2011. This loss wasn’t large enough to trigger a drop in the 2015 wetlands score, which remained steady at 60. But this downward trend in wetland acreage can’t continue if we want to reverse the Bay’s decline.
Forests
The 2015 forests score finds that 77% of the Bay watershed’s forest coverage remains. This represents an improvement in the precision of available data and not a significant decrease in actual forest area from 2011, even though the score declined by two points.
Stream Buffers
The 2015 stream buffers score remains steady at 71. Unfortunately, that means that 29% of the Bay watershed’s stream buffers – nearly 9,000 acres – have been lost to poorly planned development.
Living Resources

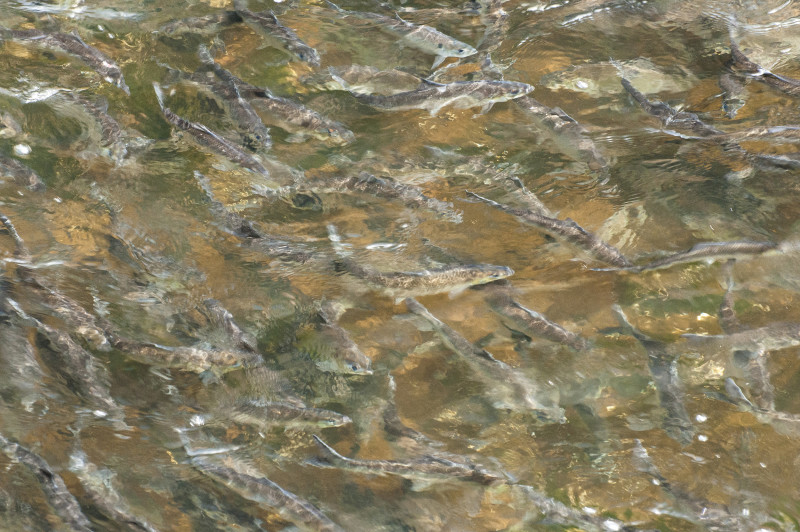
River herring are considered a “foundation” fish in the Bay ecosystem because they provide a vital source of food for sport fish such as striped bass, as well as water birds.
Eelgrass
In 2015, the eelgrass score did not change from its 2011 score of 23. This score is based on the extent of eelgrass meadows in the Bay in 2015 compared with the Bay’s maximum historical potential eelgrass coverage (estimated by the Buzzards Bay National Estuary Program).
Bay Scallops
The bay scallop score fell to 2 in 2015, down one point from 2011. The Massachusetts Division of Marine Fisheries reported an average catch of roughly 1,500 bushels per year between 2011-2015. It’s a stunning decline from 1985, when nearly 70,000 bushels of bay scallops were harvested from Buzzards Bay.
River Herring
Today, only a fraction of the historic populations of river herring still make the journey up the Bay into local streams and ponds. The 2015 score increased to 2, up one point from 2011 and 2007. Although populations have increased slightly over the past decade, they remain dangerously low.