How the Coalition tracks the health of Buzzards Bay
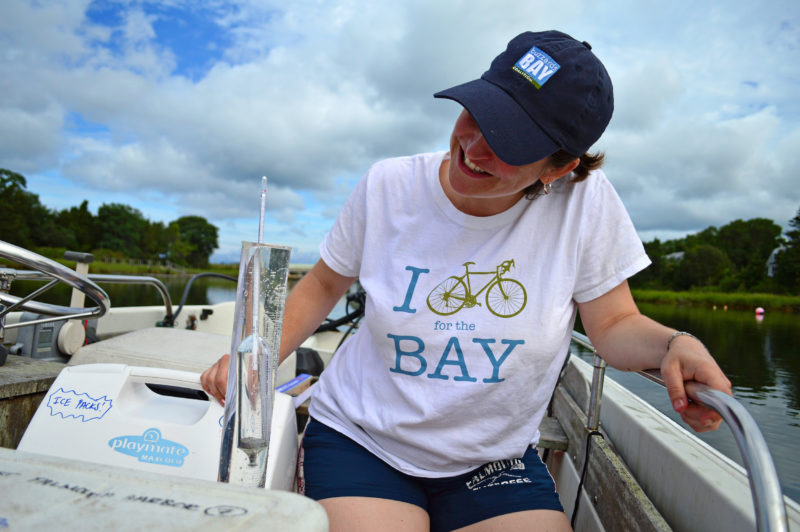
It’s early one August morning on West Falmouth Harbor, a body of water nestled in a quiet Cape Cod community on Buzzards Bay’s eastern shore. Coalition Science Director Rachel Jakuba loads supplies – a backpack, a couple of coolers, and a tackle box filled with special equipment – onto a small boat, and then slowly takes off onto the harbor’s calm waters.

Coalition Science Director Rachel Jakuba takes water samples on West Falmouth Harbor as part of the Baywatchers program, which has tracked the health of Buzzards Bay for over 20 years.
On this morning, the same scene is playing out at dozens of locations across the shores of Buzzards Bay, from Falmouth all the way to Westport. It’s a nutrient sampling day – the final of four dates this summer when Coalition staff and volunteers coordinate to take a snapshot of the Bay’s health. From boats like Jakuba’s in West Falmouth to piers, docks, beaches, and jetties all around the Bay, nearly 100 people are on the water collecting a simple series of water samples that form the foundation of all the Coalition’s work.
For about two hours, Jakuba uses a map and a GPS device to navigate the boat from spot to spot around the harbor. The locations seem random – near the shoreline here, by a mooring ball in the middle of the harbor there – but they’re actually designated sampling stations. Coalition staff and volunteers have tested these same spots every summer for the past 23 years, amassing a comprehensive body of data on pollution, temperature, and other key indicators of the health of this well-loved harbor.
At each station, Jakuba takes two water samples. Once she’s collected all of the samples she needs, Jakuba will drive them to the Marine Biological Laboratory (MBL) in Woods Hole, where they’ll be tested for nitrogen along with nearly 200 other samples collected across Buzzards Bay that morning.
What is nitrogen pollution?

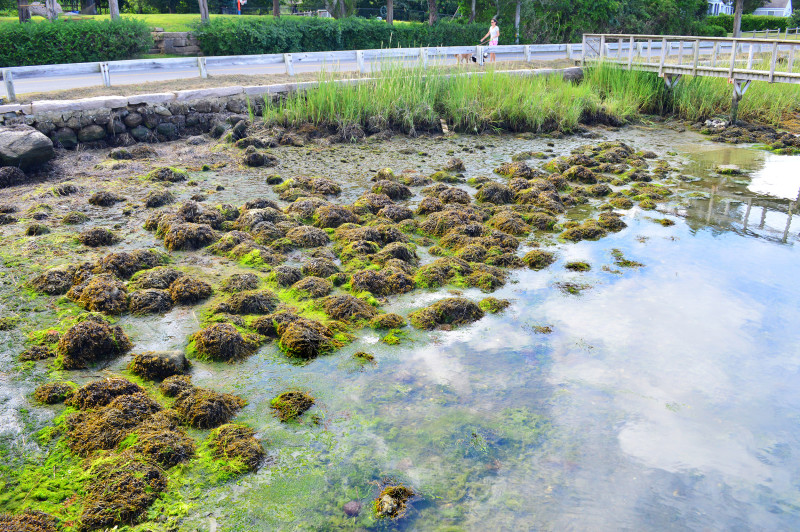
Algae collects on rocks along the shore of West Falmouth Harbor. This is a sign of nitrogen pollution.
Nitrogen is a type of nutrient that’s found in every living creature. It also comes from sources such as animal waste, lawn fertilizer, car exhaust, and acid rain. Nitrogen is essential to our survival, but when too much of it gets into our waterways, it becomes pollution.
When nitrogen pollution collides with warm summer water temperatures, it can fuel the growth of algae blooms. These cloudy, murky blooms blanket the water’s surface, blocking sunlight from reaching eelgrass growing at the bottom. Many fish and shellfish – particularly bay scallops, one of the Bay’s signature species – depend on eelgrass for their survival. So if eelgrass goes away, our aquatic life can vanish, too.
The biggest source of nitrogen pollution in Buzzards Bay comes from septic systems – the result of decades of sprawling residential development across the region. Many homes in rural and suburban areas are linked to traditional septic systems, most of which don’t remove nitrogen.
Another major source of nitrogen is wastewater treatment plants. Here on West Falmouth Harbor, nitrogen pollution – mostly from the local wastewater treatment plant – landed the harbor on the EPA’s “dirty waters” list. Two years ago, the Coalition worked with the town of Falmouth and the Massachusetts Dept. of Environmental Protection to issue a better permit for the plant that would limit the amount of nitrogen discharged into the harbor.
How does the Coalition track nitrogen pollution in Buzzards Bay?
Monitoring Buzzards Bay for nitrogen pollution is a task that involves lots of people: from Coalition staff and dozens of volunteers to interns, students, and scientists.
On four mornings each summer (twice in July and twice in August), staff and volunteers head out to nearly 30 rivers, coves, and harbors around the Bay. Their goal is to collect as many water samples as possible during the last three hours of the outgoing tide. That’s when the water should show the strongest signal of nitrogen coming off the land.
The sampling process is relatively simple. At each location, volunteers collect water in two bottles: one brown and one white. From the boat on West Falmouth Harbor, Jakuba dunks one of the bottles into the water for a moment, and then pulls it back up to the surface, caps it, and shakes it. This is to make sure there isn’t any leftover wash water trapped inside that could affect the sample’s test results. She dumps out the water, and then fills up the bottle again, this time all the way to the top. Jakuba repeats this process with the second bottle. Both bottles go into the cooler, filled with ice packs to keep the samples cool until she gets to the lab.
Next, she collects a few other key measures of the water’s conditions: temperature, salinity, and water clarity. In addition to the four nutrient sampling days, volunteers go out once a week throughout the summer to take these measurements. It’s all part of the Coalition’s award-winning Baywatchers program, a 20-plus year effort to monitor the Bay’s health.
Dropping a secchi disk – a black-and-white circle on the end of a rope – into the water, Jakuba watches the disk sink lower and lower. The water is relatively clear today; when the secchi disk hits bottom about two-and-a-half feet down, she can still see its pattern. The visibility in West Falmouth Harbor can sometimes be much worse. Thick algae blooms have become common here during the past decade, leading to eelgrass losses around the harbor.
Once she’s collected water samples at all of the harbor’s sites – about a dozen altogether – Jakuba packs up the coolers and brings them to MBL. A team of three technicians is waiting for her at the lab. When she arrives, they spring into action.
Working together, the team processes all of the West Falmouth Harbor samples. First they filter the water into smaller marked bottles to remove any particles. Then each sample is neatly recorded in a log.
Volunteers pop in throughout the morning, bringing their own coolers full of water bottles from other harbors and coves. The big delivery will happen later, when Coalition staff from New Bedford haul in all of the water samples collected on the other side of the Bay.
It will take this team of technicians about two weeks to process and analyze all the samples collected today – approximately 200 in all.
Is nitrogen pollution getting better or worse in Buzzards Bay?

Nitrogen pollution varies across Buzzards Bay. For instance, on the Agawam River in Wareham, nitrogen levels downstream of the local wastewater treatment plant have noticeably decreased since the town upgraded the plant to remove more nitrogen.
The answer to this question depends on where you’re standing. Nitrogen pollution varies widely across Buzzards Bay’s rivers, coves, and harbors. On Penikese Island, located in open waters near the mouth of the Bay, nitrogen pollution is nearly nonexistent. Whereas in the Acushnet River, just upstream from New Bedford Harbor, the water has been plagued for years by nitrogen pollution.
In some places, experts are optimistic that pollution problems may be improving. On the Agawam River in Wareham, nitrogen levels downstream of the local wastewater treatment plant have noticeably decreased since the town upgraded the plant to remove more nitrogen. Back on West Falmouth Harbor, the Coalition expects that the harbor’s health will improve in coming years due to upgrades.
But in other areas, the picture isn’t so bright. The East Branch of the Westport River is suffering from nitrogen pollution due to increased development that brought more people and septic systems to the area. And many waterways along Buzzards Bay’s Cape Cod coast, such as Red Brook Harbor, Rands Harbor, and the Back River, have also gotten worse in recent years.
Even if you don’t see algae blooms in your local harbor or river, it might still be suffering from nitrogen pollution. That’s why the Coalition’s consistent, coordinated effort to collect and test all these water samples is so important. With this data, we can see how the Bay’s health is changing over time and work to make choices to protect clean water before nitrogen pollution gets worse.
New data on Buzzards Bay’s water temperatures suggests that this problem could be growing even bigger.
Thanks to a $1 million grant from the MacArthur Foundation, the Coalition is working with scientists at the Woods Hole Oceanographic Institution (WHOI) to expand our water monitoring program and look for evidence of the effects of a changing climate
Already, WHOI scientists have begun to look back at the Coalition’s data to search for clues of global warming on the Bay’s health. Analyzing 20 years of data from 28 monitoring stations, scientists discovered that the average water temperature has increased at half those stations. Algae have increased, too – much more than scientists would have expected based on corresponding increases in nitrogen levels.
Though it’s preliminary, this study hints that global warming-linked temperature increases may be causing algae to grow faster, even if nitrogen pollution isn’t increasing at the same rate. So even if the sources of pollution to Buzzards Bay aren’t growing, the effects might be.
What can people do to stop nitrogen pollution?

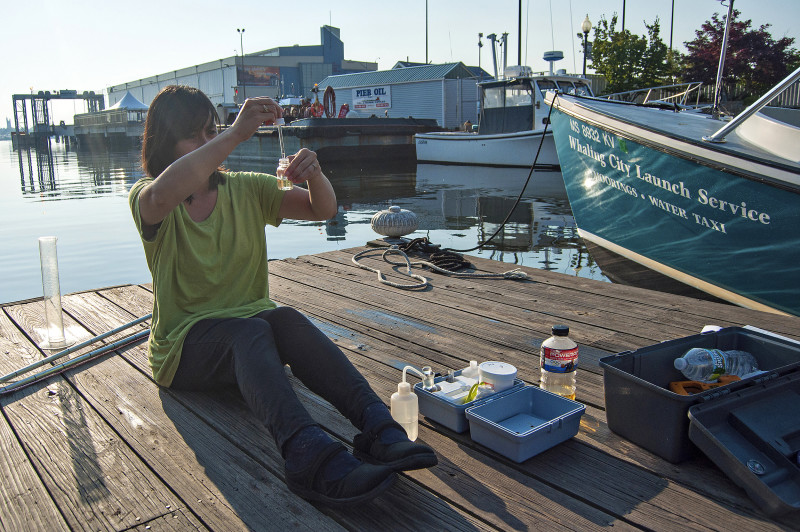
Baywatchers like Jessamyn Finneran test water samples at over 200 sites around Buzzards Bay every summer.
There are lots of ways people like you can stop nitrogen pollution. The most important thing you can do is to vote for clean water policies in your community. Whether on a ballot or at your next town meeting, your support for initiatives to reduce pollution and protect land is the biggest way that you can make a difference for Buzzards Bay.
Small changes around your home can also help keep our water clean. You can cut back on lawn fertilizer, plant a few trees, pick up pet waste, and lots of other simple actions. Our What You Can Do page has a list of tips to help you be more Bay-friendly every day.
If you want to get involved and help the Coalition test for nitrogen pollution in your community, you can become a Baywatcher. We’re always looking for dedicated volunteers to help collect this critical data each summer.